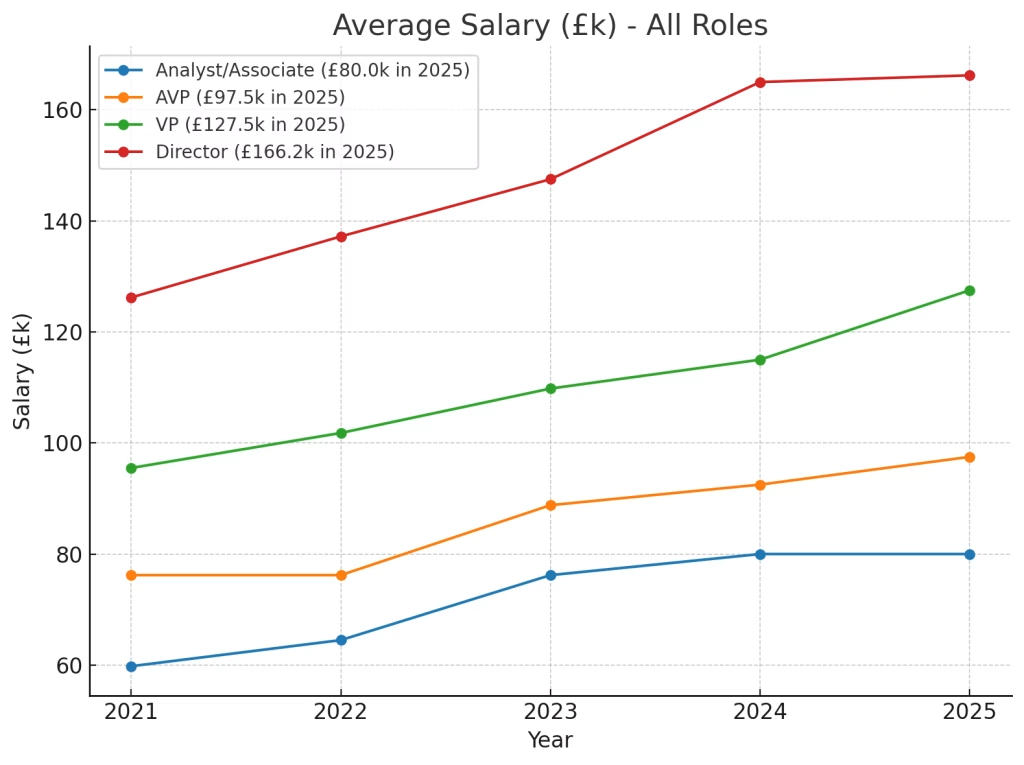
Regulatory reporting roles in London have evolved significantly in the past five years, both in scope and in compensation. There’s much more of a focus on technology skills than there were in the past. The analysis below, with original data from Robert Walters, shows average base salaries (excluding bonuses, benefits, and other perks) for permanent roles across both Medium and Large Enterprises, calculated from the midpoints of surveyed salary ranges.
By looking at averages instead of ranges, we can see the true shape of salary growth – both in absolute terms (£k) and in percentage terms. Here, we also include the compound anual growth rate (CAGR) for each role, giving a clearer view of sustained momentum.
My analysis is only as good as the underlying data and collection methodology itself. Arguably the salaries in the underlying data are likely to be skewed by people on the higher end of the experience band. The salaries shown here aren’t for advertised roles, they are salaries received by those currently in regulatory reporting roles. This is important to consider when looking at the Vice President and Director roles which may be skewed by long tenured salaries. This is meant to be an illustrative analysis of salary trends, not an absolute. The salaries don’t account for bonuses, holidays, pension contributions nor working conditions, such as hybrid or fully remote.
PQE: Post-qulification experience.
Assistant Vice President: May also be known as a manager.
Vice President: May also be known as a senior manager.
Director: May also be known as a head of.
If you’d like to see what a potential career pathway could look like in Regulatory Reporting, check out this post.
All Roles
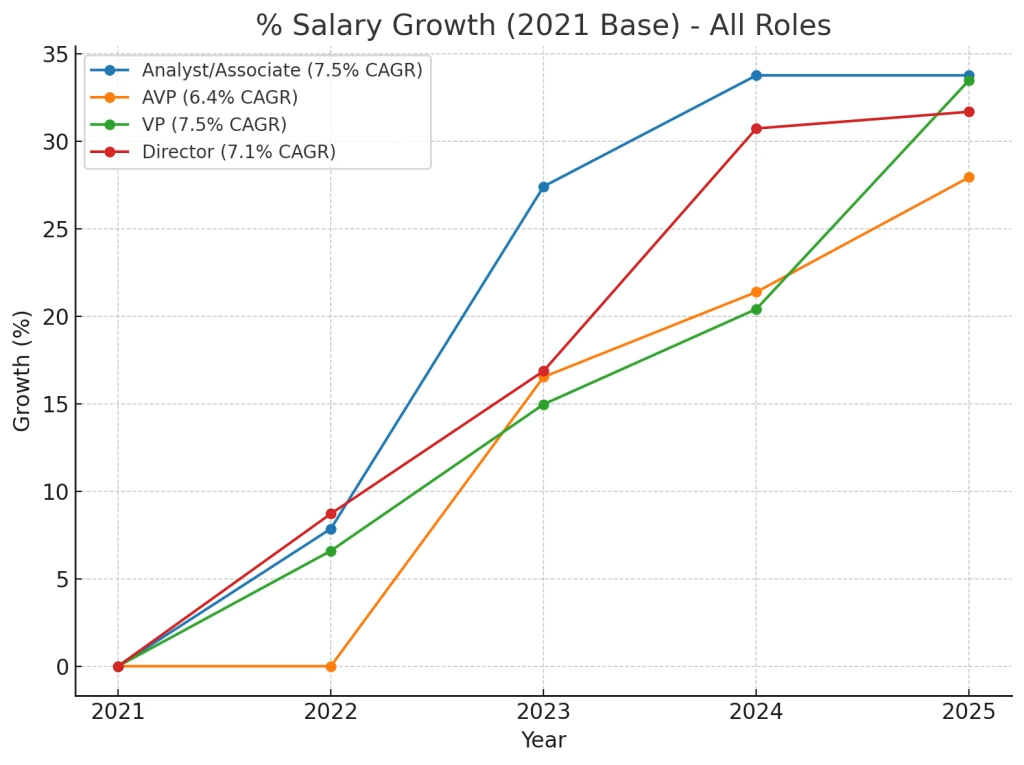
The charts reveal two distinct stories:
- Fastest proportional climbers: Analysts and VPs, both driven by market demand for operational execution and leadership in regulatory change.
- Steady, dependable risers: AVPs and Directors, with stable growth patterns that avoid volatility.
This reinforces the idea that while senior roles offer the highest absolute earnings, the largest proportional opportunities for salary growth are at the entry and mid-senior levels.
Key Observations
Analysts and VPs lead in proportional growth
- Analysts grew by 33.8% and VPs by 33.5% over the period, both achieving a CAGR of ~7.5% per year.
- The Analyst curve is steep between 2021–2024 but then flattens completely in 2025, reflecting a plateau in junior-level pay.
- VP growth is steadier and more evenly distributed across the years, indicating a consistent push to increase mid-senior leadership pay.
AVPs grow steadily but more modestly
- AVP salaries rose by 28% over the period, with a CAGR of 6.4% per year.
- The line shows smaller year-to-year jumps, suggesting incremental adjustments rather than large market corrections.
- This may reflect AVPs being in a “transition” pay band, where salary progression is less volatile than junior or senior extremes.
Directors maintain steady, sustained growth
- Directors experienced 31.7% total growth with a CAGR of 7.1% per year.
- The line is the smoothest of all four roles, showing no sudden jumps, which aligns with the stability of senior-level compensation structures.
- Despite lower proportional growth than Analysts and VPs, Directors saw the largest absolute £k gain (+£40k).
Gap between roles is proportional, not directional
- All four curves trend upward, meaning no group saw a real-term decline.
- The relative spread between lines remains fairly consistent, indicating that pay structures at each level moved together, without major compression or expansion of salary gaps.
What About Inflation?
CPI is calculated for the UK and cannot be isolated specifically for London. But using official CPI figures from the Office for National Statistics, cumulative UK inflation from 2021 to mid-2025 totals 25.4%, which equates to an annualised rate (CAGR) of roughly 5.8% per year.
This means any salary growth above 25.4% over the period has increased real purchasing power, while anything below it has resulted in a real-terms decline.
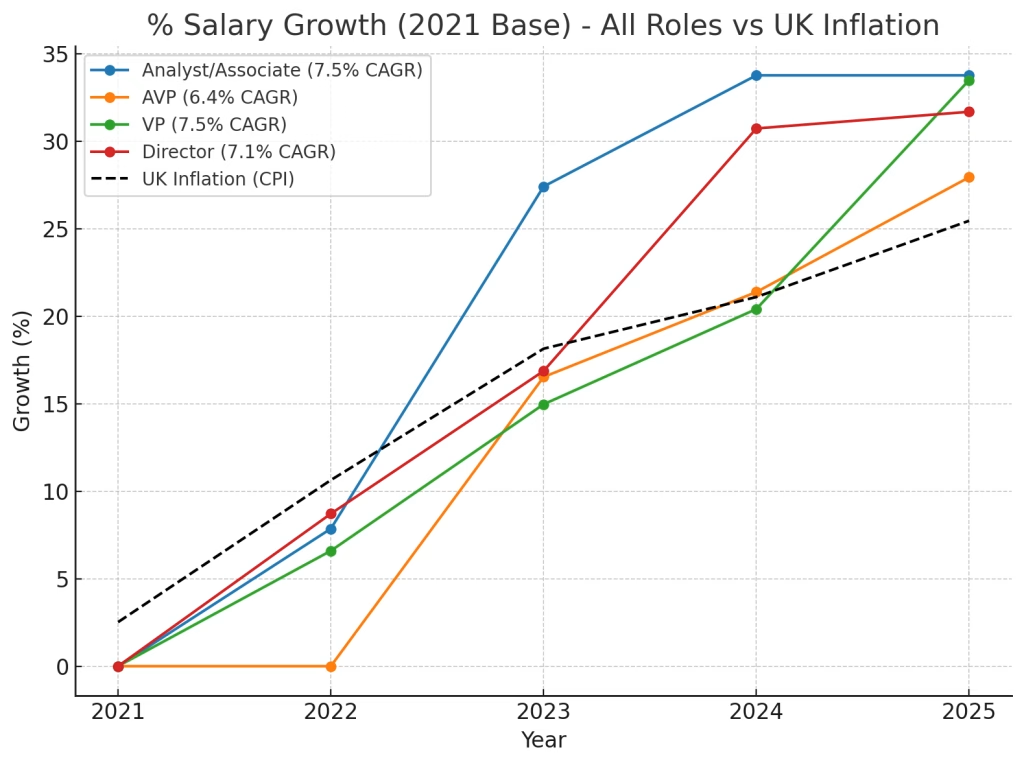
Chart insights:
- All roles have outpaced inflation over the period, with Analysts and VPs achieving the largest margins above the CPI curve.
- AVP salaries sit just above the inflation line, indicating modest real-terms improvements.
- Directors consistently stay above inflation, though with a smaller proportional lead than junior and mid-senior roles.
Analyst / Associate (2–4 years’ PQE)
Absolute growth: £59.8k in 2021 → £80k in 2025, a gain of £20.2k.
Total % growth: +33.8% over the period.
Annualised growth rate (CAGR): 7.5% per year.
- Medium Enterprises started at £52.5k but caught up completely by 2024.
- Large Enterprises started higher (£67k in 2021) and grew more slowly.
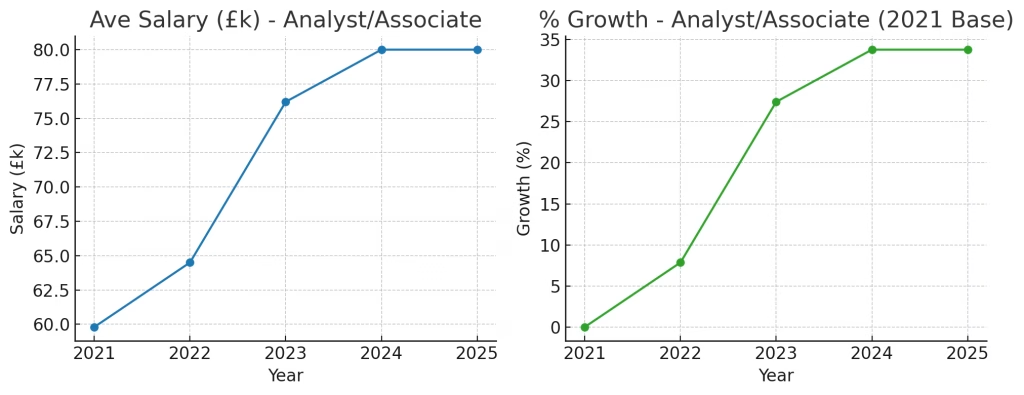
Chart insight: The absolute salary chart shows a steep climb until 2024, then a flat line. The percentage growth chart confirms the plateau, with growth halting after 33.8%.
Assistant Vice President (AVP) (3–5 years’ PQE)
Absolute growth: £76.2k in 2021 → £97.5k in 2025, a gain of £21.3k.
Total % growth: +28.0% over the period.
Annualised growth rate (CAGR): 6.4% per year.
- Medium Enterprises saw sharper proportional growth, starting at £63k in 2021 and matching Large Enterprises by 2025.
- Large Enterprises dipped slightly in 2022 before rebounding.
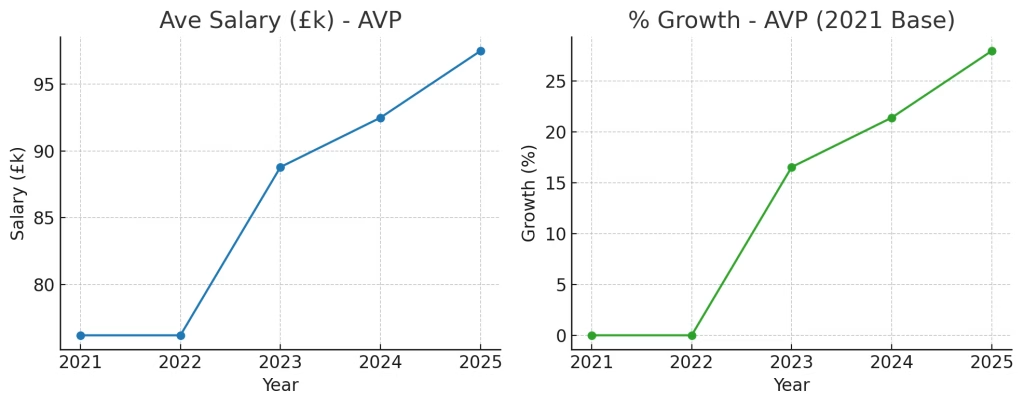
Chart insight: Unlike Analysts, AVP salaries keep climbing through 2025 with no plateau, indicating steady upward momentum.
Vice President (VP) (5–10 years’ PQE)
Absolute growth: £95.5k in 2021 → £127.5k in 2025, a gain of £32k.
Total % growth: +33.5% over the period.
Annualised growth rate (CAGR): 7.4% per year.
- Medium Enterprises have nearly erased the pay gap, moving from £82k to £125k.
- Large Enterprises rose more steadily, from £109k to £130k.
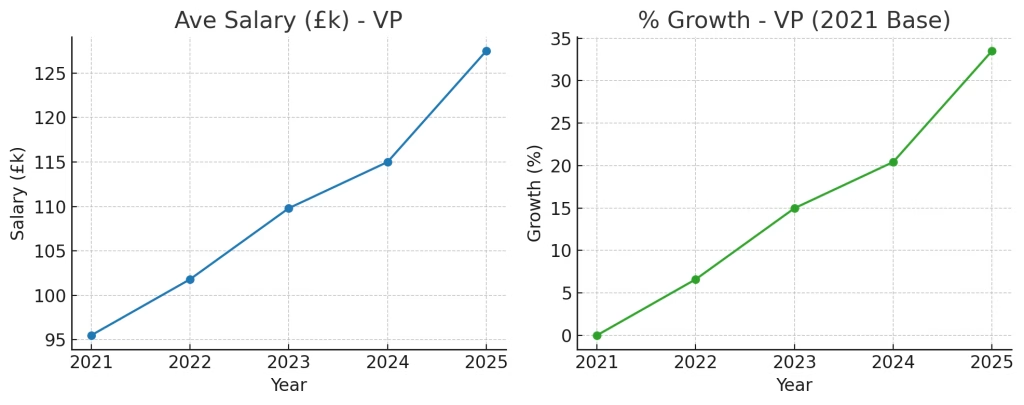
Chart insight: VP salaries show one of the steepest proportional increases, rivaling Analysts in CAGR but from a much higher base.
Director (8–10+ years’ PQE)
Absolute growth: £126.2k in 2021 → £166.2k in 2025, a gain of £40k.
Total % growth: +31.7% over the period.
Annualised growth rate (CAGR): 7.1% per year.
- Medium Enterprises closed the gap to within £8k by 2025.
- Large Enterprises kept a slight lead (ending at £170k).

Chart insight: Directors have the largest absolute salary gain, and while their CAGR is slightly lower than Analysts and VPs, the consistent year-on-year rise highlights sustained market demand.
Key Takeaways
- At all levels, Regulatory Reporting salaries have far outpaced inflation since 2021.
- Medium Enterprises have caught up – By 2025, average salaries for all four roles in Medium Enterprises match or nearly match those in Large Enterprises.
- Highest annualised growth for Analysts and VPs – Both average ~7.5% per year, indicating that entry-level and mid-senior roles have been the fastest climbers proportionally.
- Analyst plateau – Despite strong early growth, Analyst salaries have flatlined since 2024, likely due to market stabilisation.
- Directors see the biggest £k gain – While their annualised growth rate is slightly lower, Directors enjoyed the largest absolute increase (+£40k).